How to monitor GridGain 9 with Prometheus and Grafana
Export GridGain 9 metrics over OTLP to Prometheus, then connect Grafana to visualize cluster performance with a prebuilt dashboard.
Prerequisites
- GridGain 9.0.13 or later
- Grafana OSS 11.5.0
- Prometheus server 3.1.0
Overview
GridGain offers built-in support for monitoring its performance using tools like Prometheus and Grafana. This guide walks you through setting up GridGain to send metrics to Prometheus via the OpenTelemetry (OTLP) protocol, and configuring Grafana to visualize these metrics.
The integration process has three steps:
Configure GridGain
To export metrics from your GridGain cluster, you need to modify the cluster configuration via the CLI tool.
-
Open the CLI and connect to any node in the cluster.
-
Specify the
exporterNameas the name for your OTLP endpoint and theendpointas the address of your Prometheus server. -
Run the
cluster config updatecommand with the modified configuration as an argument. The updated configuration is automatically applied across the cluster.cluster config update ignite.metrics.exporters.test: {exporterName:otlp, endpoint:"http://localhost:9090/api/v1/otlp/v1/metrics", protocol:"http/protobuf"} -
After successfully running the command, you see a
Cluster configuration was updated successfullymessage, and GridGain automatically starts sending metrics to the specified endpoint.
If it is your first time setting up a GridGain cluster, check the corresponding documentation section for more details.
Configure the Prometheus server
GridGain 9 comes with a built-in OTLP provider that lets you export the cluster's metrics. These metrics can then be collected and processed by Prometheus without any extra configuration steps.
All you need to do is start your Prometheus server with the --web.enable-otlp-receiver option to receive metrics:
- Unix
- Windows
./prometheus --config.file=./prometheus.yml --web.enable-otlp-receiver
prometheus.exe --config.file=./prometheus.yml --web.enable-otlp-receiver
By default, Prometheus starts on port 9090. Check http://localhost:9090 to verify it is up and running.
For further instructions and how-to guidance, see the Prometheus documentation.
Configure Grafana
Finally, you set up Grafana to monitor and display your metrics.
-
Download and install Grafana.
-
Once installed, start Grafana:
- Unix
- Windows
./grafana-servergrafana-server.exeBy default, Grafana is available at http://localhost:3000/login.
-
Use the default login credentials:
admin/admin. You must change them after your first login for security reasons. -
Navigate to Connections/Data sources and select Add data source.
-
Add Prometheus as the data source.
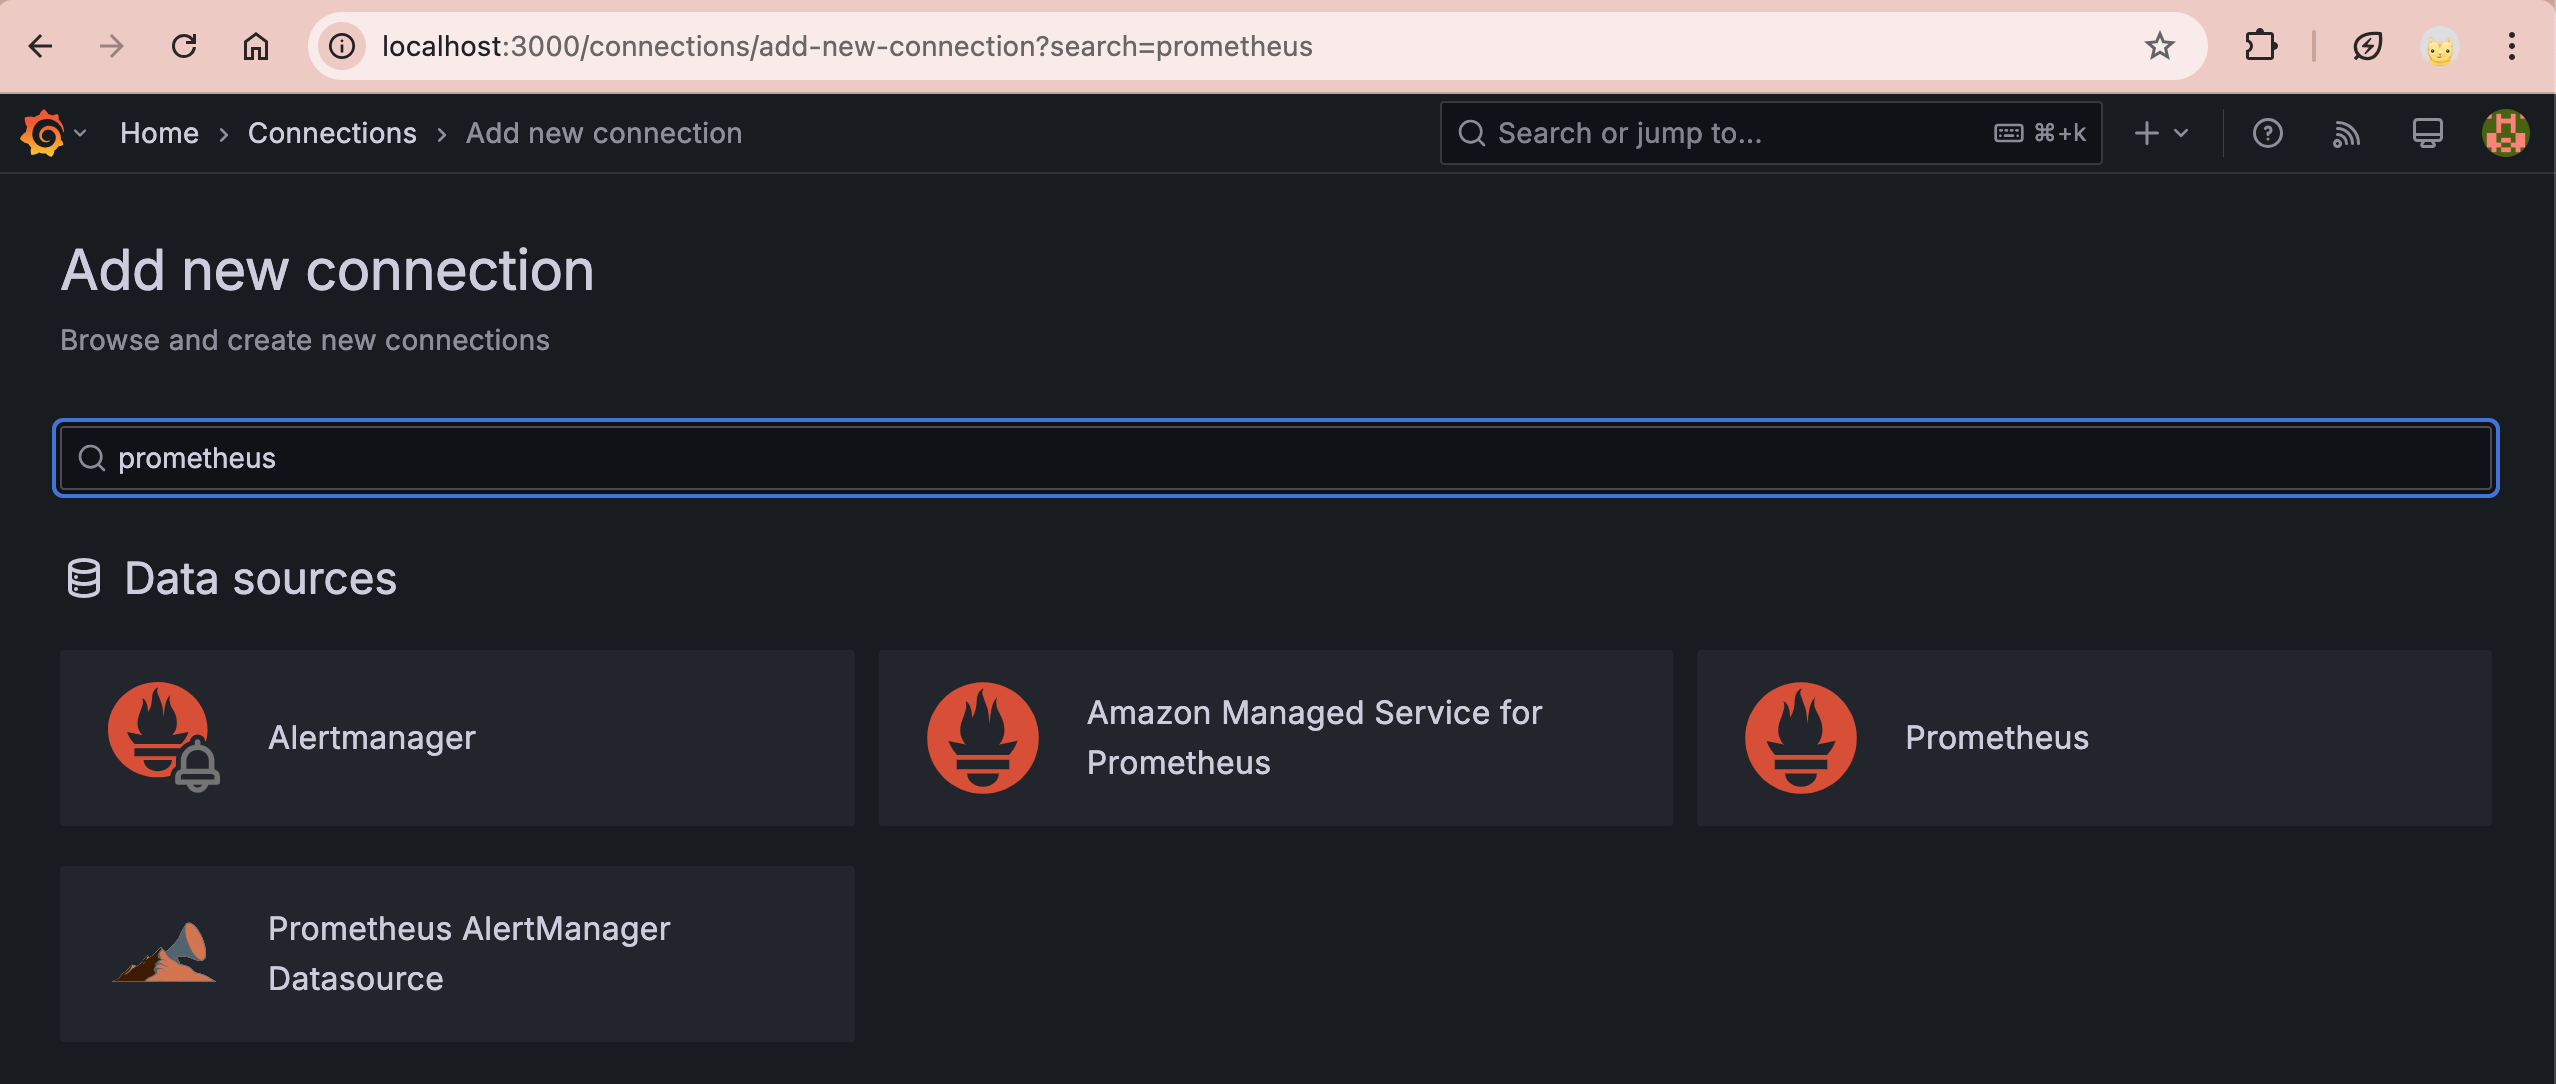
Once configured, Grafana starts receiving GridGain metrics from Prometheus. For a more detailed installation guide and how-to guidance, refer to the official documentation.
Importing a sample dashboard
To help you quickly start collecting and visualizing GridGain metrics, we have prepared a pre-configured sample dashboard that you can import into Grafana. This dashboard provides a structured view of key cluster metrics, making it easier to monitor performance in real time.
-
Download the sample dashboard JSON file.
-
Go to Dashboards → Create Dashboard, click Import Dashboard, and upload the file.
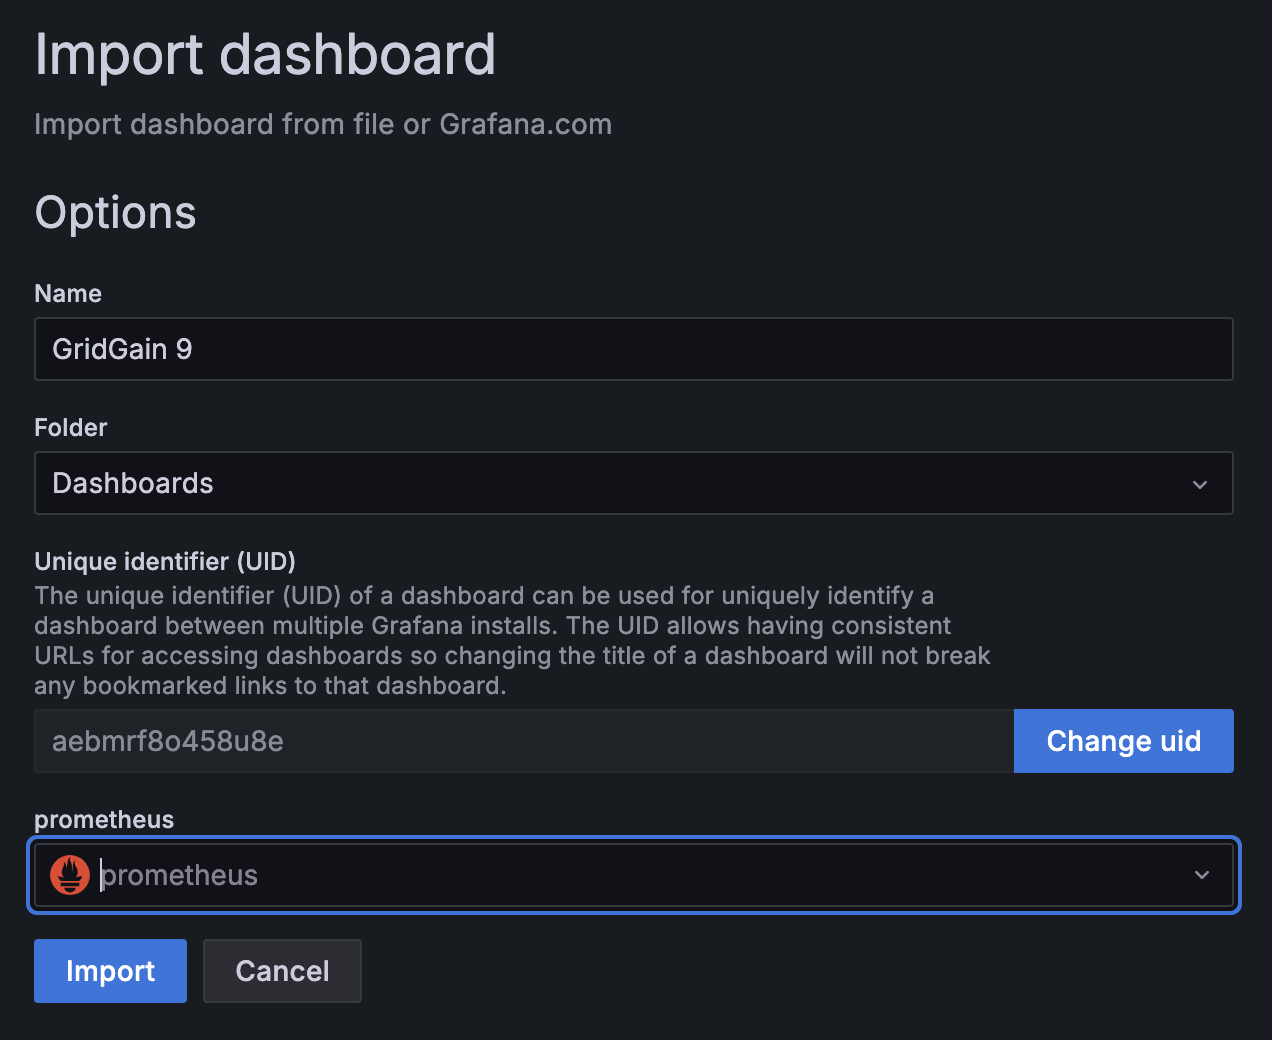
-
After a successful import, Grafana displays your cluster metrics.
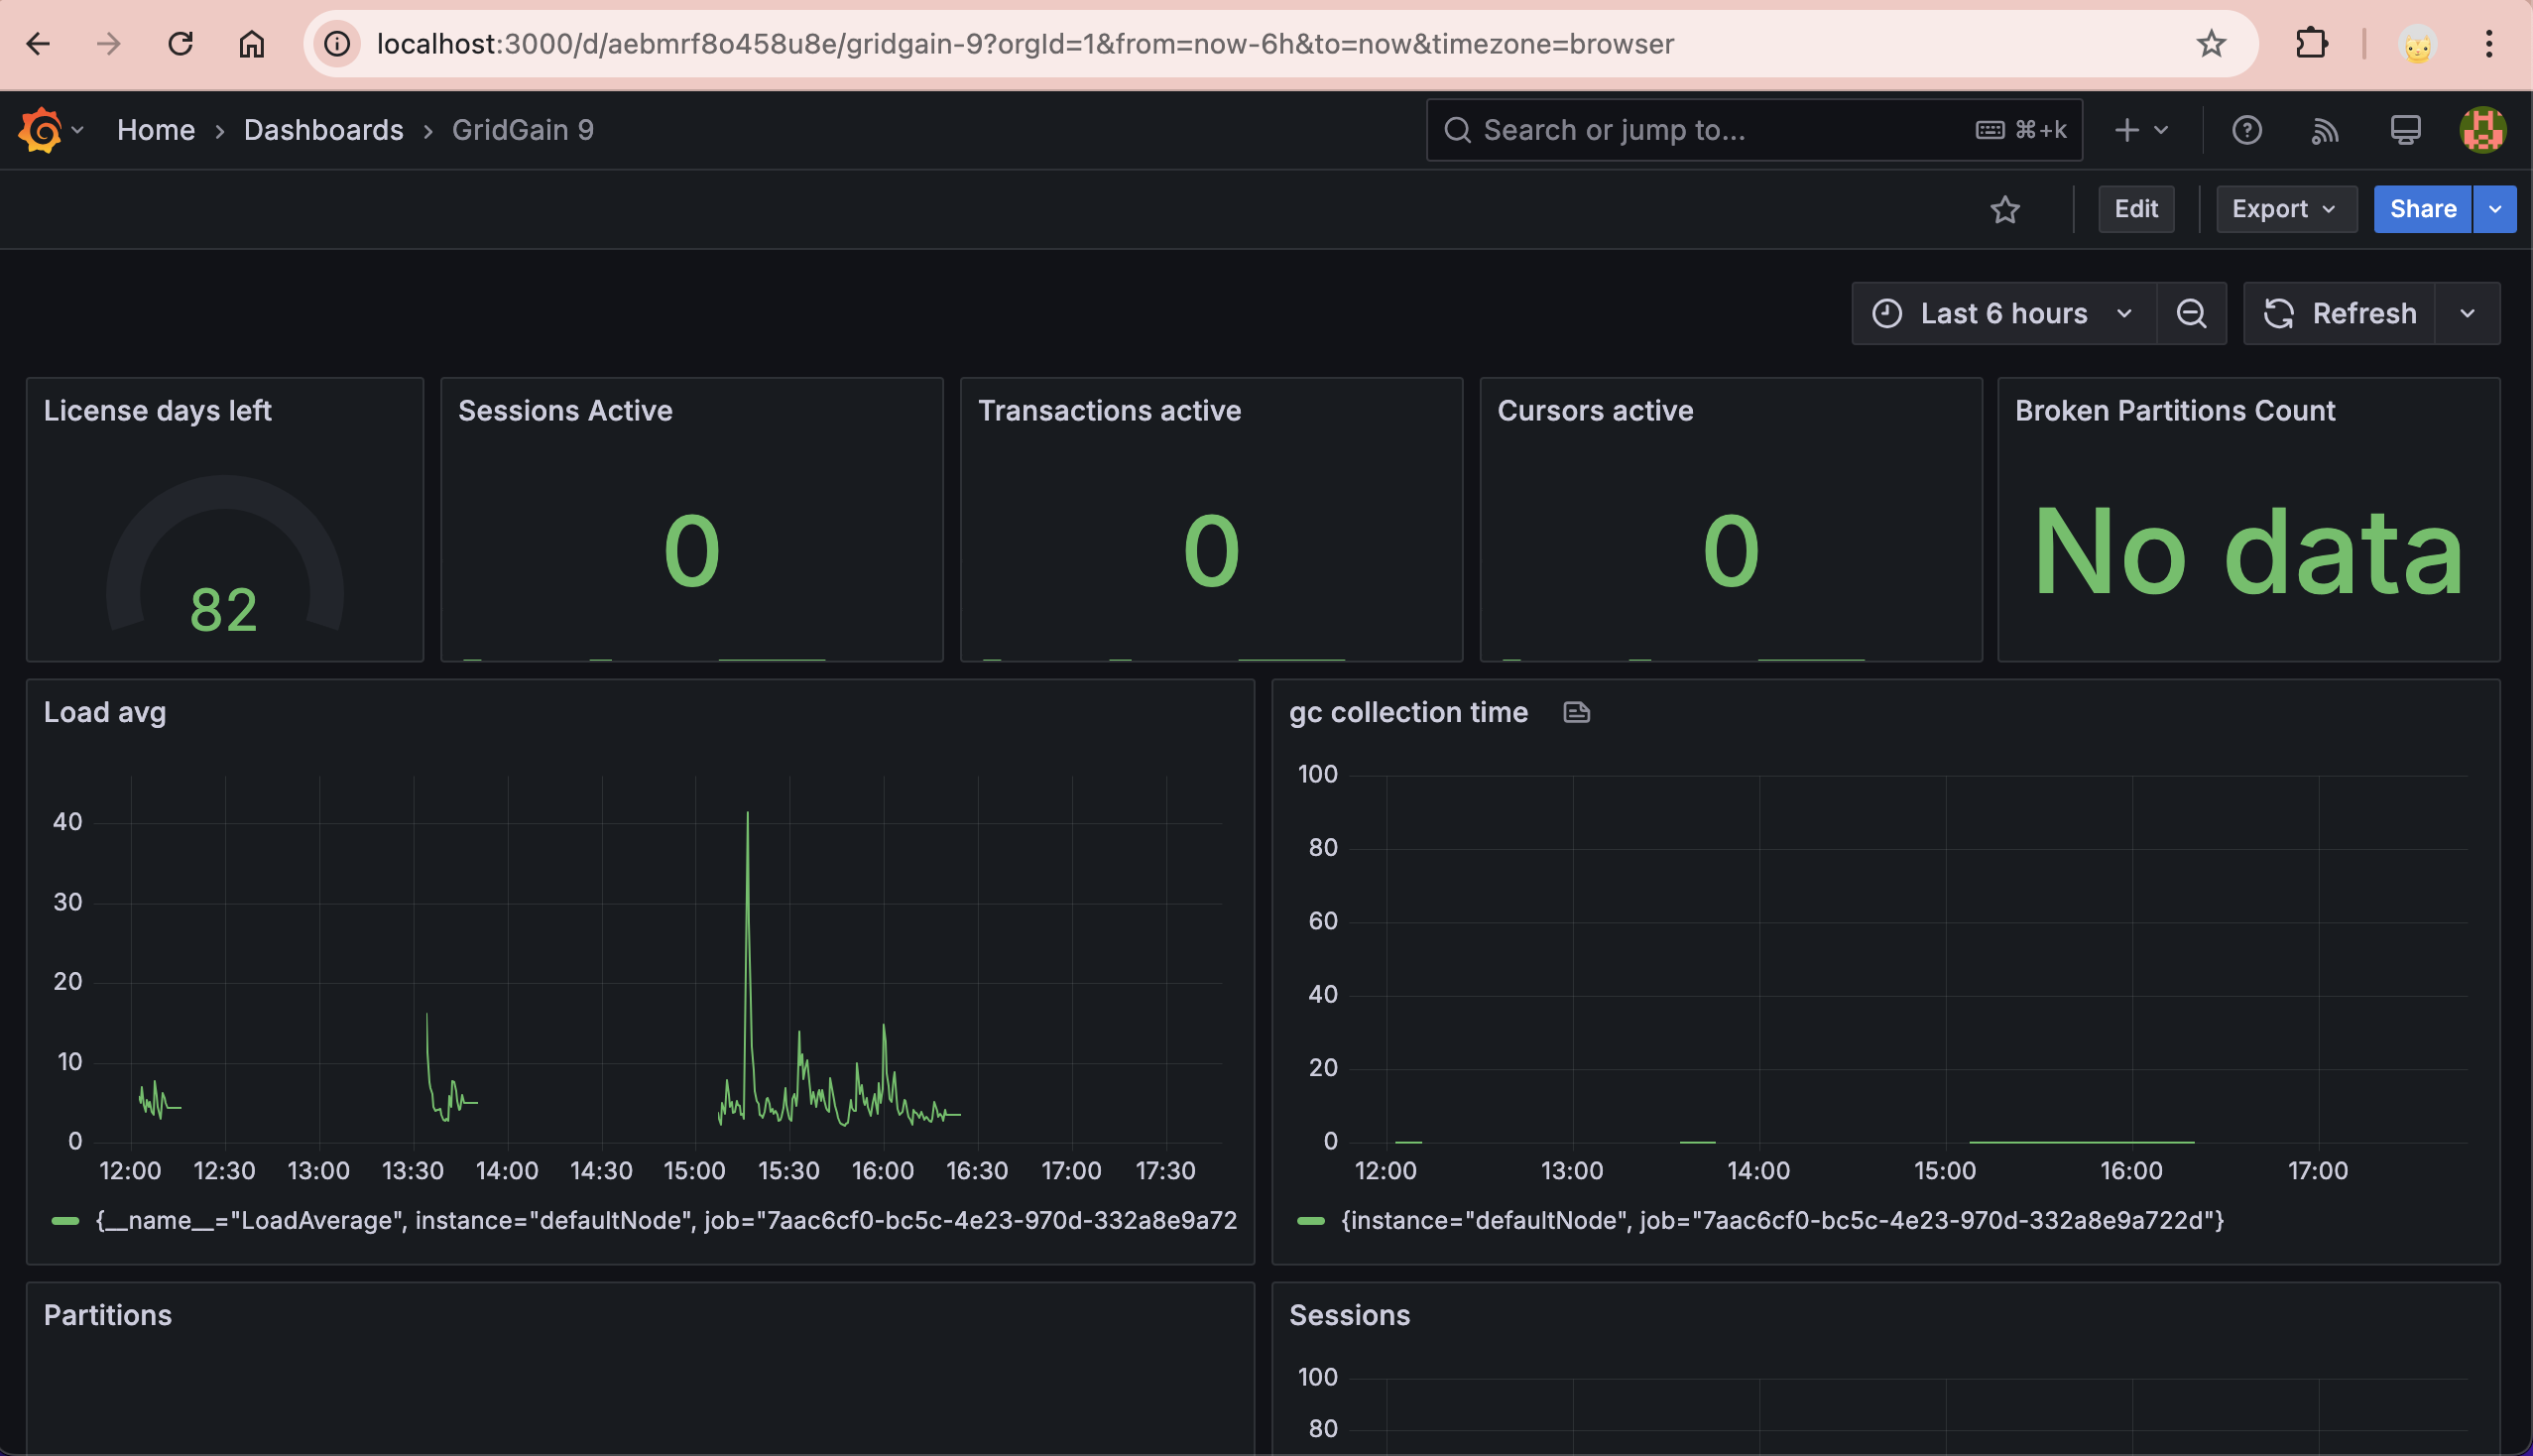
Now that your dashboard is set up, you have a comprehensive view of your GridGain metrics, enabling efficient monitoring, analysis, and performance tuning. To dive deeper into metrics and monitoring in GridGain, visit the corresponding documentation section.
Related
- Configuring metrics in GridGain 9 - Reference for the metrics subsystem and available exporters.
- Prometheus getting started - Set up and configure the Prometheus server.